...
...
...
...
Auditing the First 100 Pages of the Top 100 Websites
When you’re browsing BBC news, or streaming your favourite Youtube videos, I doubt you’re thinking about the site’s accessibility. We all frequent the same sites but are they setting good standards of accessibility and performance? Does a site’s popularity correlate with these standards? Let’s find out 💪.
I decided to audit 100 pages per site. This would be a good amount of data to give each site an average. As I’m sure you’ll agree, assessing 10,000 pages manually would be far too time consuming. Luckily, with a little automation and the power of lighthouse we can audit them all with a click of a button instead.
Not interested in the code? Check out the results here.
Disclaimer: This was a fun experiment. Results here are by no means a complete or comprehensive assessment of the audited sites. All views expressed in this article are my own and do not represent the opinions of any entity with which I have been, am now or will be affiliated with.
How I Audited 10,000 Web Pages
Puppeteer
One of my favourite npm packages that I have discovered in the last year is puppeteer. Puppeteer is a Node library that provides an API to control chrome over the dev tools protocol. It can run headless (in the background), so you don’t even see it working away.
this.browser = await puppeteer.launch();
this.page = await this.browser.newPage();
await this.page.goto("[http://sld.codes/](http://sld.codes/)");
await this.page.screenshot({path: `screenshot.png`, fullPage: true});
A super simple example of the power of this tool can be seen above. By running this snippet, a chromium instance will open in the background, navigate to my personal website, and take a full page screenshot of the page.
Clustering
You can also run a cluster of puppets! This allows you to tackle larger problems asynchronously with multiple instances of puppeteer workers. A simple example of how this works can be found in the readme:
const { Cluster } = require('puppeteer-cluster');

(async () => {
  const cluster = await Cluster.launch({
    concurrency: Cluster.CONCURRENCY_CONTEXT,
    maxConcurrency: 2,
  });

  await cluster.task(async ({ page, data: url }) => {
    await page.goto(url);
    const screen = await page.screenshot();
  });

  cluster.queue('[http://www.google.com/'](http://www.google.com/'));
  cluster.queue('[http://www.wikipedia.org/'](http://www.wikipedia.org/'));

  await cluster.idle();
  await cluster.close();
})();
Lighthouse
There is no better tool out there for automated auditing. Most people are familiar with its integration into the chrome dev tools but you can also run it using a node CLI. All I needed to do to get it going was to point it to the puppeteer instance.
var { lhr } = await lighthouse(this.page.url(), {
      port: new URL(this.browser.wsEndpoint()).port,
      output: "json",
      quiet: true,
});
Sourcing the top 100
You can define the top 100 sites in lots of different ways. For this experiment, I settled on Top 100 most visited by search traffic. I sourced the list here. With a little regex and a few multi cursors, I got the table on the page into JSON. I could then feed it to the cluster.
The Script
The web-crawler I created was fairly basic. Upon landing on a webpage, it would look through and search for any <a> tags and add the hrefs to a first-in first-out queue. I used a set to hold visited urls to ensure I didn’t audit the same page twice.
let newHrefs = await page.$$eval("a", as => as.map(a => a.href));
        newHrefs = newHrefs.map(url => url.replace(//$/, ""));
        newHrefs = newHrefs.filter(
          url =>
            !toVisit.includes(url) &&
            !visited.has(url) &&
            psl.get(extractHostname(url)) === hostName
        );
It turns out sites don’t always use
<a>tags. This sometimes meant that my crawler would finish for any given site before reaching 100 pages. I didn’t notice this was the case until the audits had finished. If I were to run this experiment again I would make sure to improve the crawlers ability to search sites.
To audit all 10,000 pages, took 21 hours and 32 minutes.
That sounds like a crazy long time, but it works out to 7.74 seconds per audit. It should be noted that my internet is no where near fibre optic speeds and I am pretty sure that my provider throttled my connection. But, I don’t think this subtracts anything from the results when most of the world is still using 3G.
Visualising The Information
Time to turn 10,000 JSON files into something useful 😅.
Parsing 1.83gb of Audit Data
I ended up with 1.83gb of audit data in JSON. I have been using JSON in react and Gatsby projects for years but never have I had to import JSON of this magnitude. It was a headache. First thing I tried to do was increase the memory that node had available. Turns out I couldn’t give it enough.
It suddenly occurred to me that while these reports contained some really useful information, they also contained 3000 lines that I was not interested in. I decided to write a script that would prune the data down to the fields in the JSON that I really needed.
This reduced 1.83gb down to 50.9mb. Much more manageable!
Gatsby + GraphQL
I used the gatsby-transformer-json package to pull all the JSON into my Gatsby project. Then used this query to source the data:
{
    allAllJson {
      edges {
        node {
          categories {
            accessibility {
              score
            }
            performance {
              score
            }
            best_practices {
              score
            }
            seo {
              score
            }
          }
          id
          requestedUrl
        }
      }
    }
  }
Build was a little slow, but it worked!
Visualisations
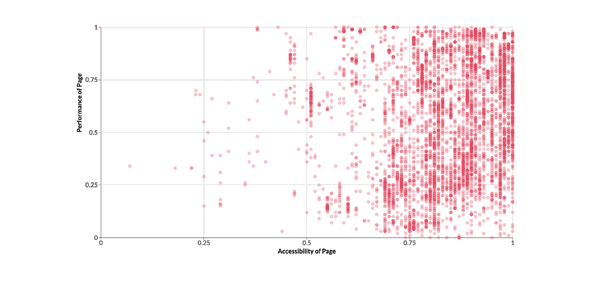
I used the recharts library, to create scatter graphs, showing the correlations. I was worried that it would not be able to handle soo many data points but I was wrong. Recharts smashed it 💪.

The Results
In the coming days, I intend to summarise the data I’ve acquired. In the mean time, you can check it out here.
...
...
...
...
Join My Newsletter
Want to know when I post something new? For the latest articles and projects straight to your inbox, subscribe to my newsletter.
